Wednesday, May 7, 2014
Tuesday, May 6, 2014
Climate change solutions video
Below is a video about the solutions to climate change and a general outline of what they think the solutions are that we should be doing. It talks a lot about solar energy and the pros and cons such as the prices and the ability to use them only with sunlight. It takes also about how it will cost more money up front, but in the long run it will be a clearly better option. Why are we not switching then?
Watch the video HERE and make a judgement for yourself.
Watch the video HERE and make a judgement for yourself.
Laws for Climate change
Below is a link to California's Global Warming Solutions Act. This bill outlines a plan to reduce emissions going into 2020, such as requiring industries to report on their emissions. This is an overall good law, but we will have to see how well they execute and plan to continue after the act is technically outdated.
Link to Bill 32 HERE
Link to Bill 32 HERE
Timelapse of deforestation
Below is a video by NASA just showing what deforestation looks like over a period of time. Just something fun to watch.
Link to VIDEO
The science of Deforestation
Here is an article about the science of deforestation and how it works. This article goes through all the different reasons why deforestation occurs such as logging and agriculture. It talks about how the main issue is in Brazil and the Amazon because it is being removed at an alarming rate. This is very thorough and goes through many different causes and then talks about solutions.
Link to article HERE
Link to article HERE
Photo of Deforestation

Figure 1: This shows deforestation and how it adds to the emissions of Carbon Dioxide, due to a lack of absorption if there are less tress. It also lists at the bottom some reasons for deforestation, which I think we need to look at and see if we can alter or stop to either stop deforestation or reduce it by a good amount.
Link to IMAGE
Deforestation and Climate change
There is a nice report on the effects of deforestation on climate change and how it actually contributes to climate change more than we may think. It talks about how deforestation releases 1.5 billion tonnes of carbon dioxide each year, which is an alarming number. It also says that it is a whole 20% of the carbon emissions caused by humans, which to me is surprising because of how much we think can cause a rise in carbon emissions. This is a really good article that also talks about how if we continue what our future could look like.
Read the article HERE
Read the article HERE
Solutions to Climate change

Figure 1: This shows simple things that we can do to help the environment. This ranges from recycling to more proactive things such as lowering thermostats when we are not home as to waste electricity, that statement that is widely known.
Link to IMAGE
Wind energy Video
Below is a simple video about wind energy and the turbines that are used to create the energy. It goes into the specifics of how a turbine works, from how the outer wings spin to why they are created so tall. It also talks about how they have gears inside to increase rotations to create enough energy to power a generator. Very informative and simple to understand.
Link to the VIDEO
Wind energy Pros and Cons
The duke university website has a nice paper outlining the pros and cons of wind energy. It talks about the obvious pros such as it is renewable, safe and will be around for a while. While the cons it talks about the limitations such as not being able to put them anywhere because not everywhere gets enough wind to power these. It is a good way to compare if you wanted to build a stance.
Check out the website HERE
Check out the website HERE
Wind Energy article
There is a nice idea called wind energy that is a renewable and safe option to get energy. On the website linked below it talks about how specifically wind energy is collected through very tall turbines that are rotated through strong winds. It mentions how they can be stand alone energy sources or can be hooked up to grids that can transfer that energy. This is a good simple read to understand basic wind energy.
Link to website HERE
Link to website HERE
Photo showing Wind energy

Figure 1: The following figure displays a wind turbine that can be used to create energy from wind. This is another positive alternative to fossil fuels as it is renewable and safe. This shows how the turbines are rotated from strong winds and in turn transfer that energy into underground electrical connections that is usable energy.
Link to IMAGE
Video about solar energy
Below is a video about solar energy and the basics behind why and how to use it. It talks about how the sun is the most powerful and renewable energy source that we have and how we should utilize it. It talks about how we have desert areas that are so vast that we could if we truly wanted place enough solar panels to capture the energy that could supply the entire Earth with energy. It talks about the two different ways to create solar energy, one way being a more direct way where the panels translate sunlight directly into electricity and the other is the traditional heating water to create steam and power plants to make energy.
Link to VIDEO
Solar energy Pros versus Cons
Solar energy is often a thought of alternative to burning oils and gases, but how much do you actually know about the making and use of solar energy. In this website there is list of pros and cons of using solar energy, some pros being that it is safer and con being that it is quite expensive to build them. Check out if you think the Pros outweigh the cons below.
Link to website HERE
Link to website HERE
Mitigation: Solar energy
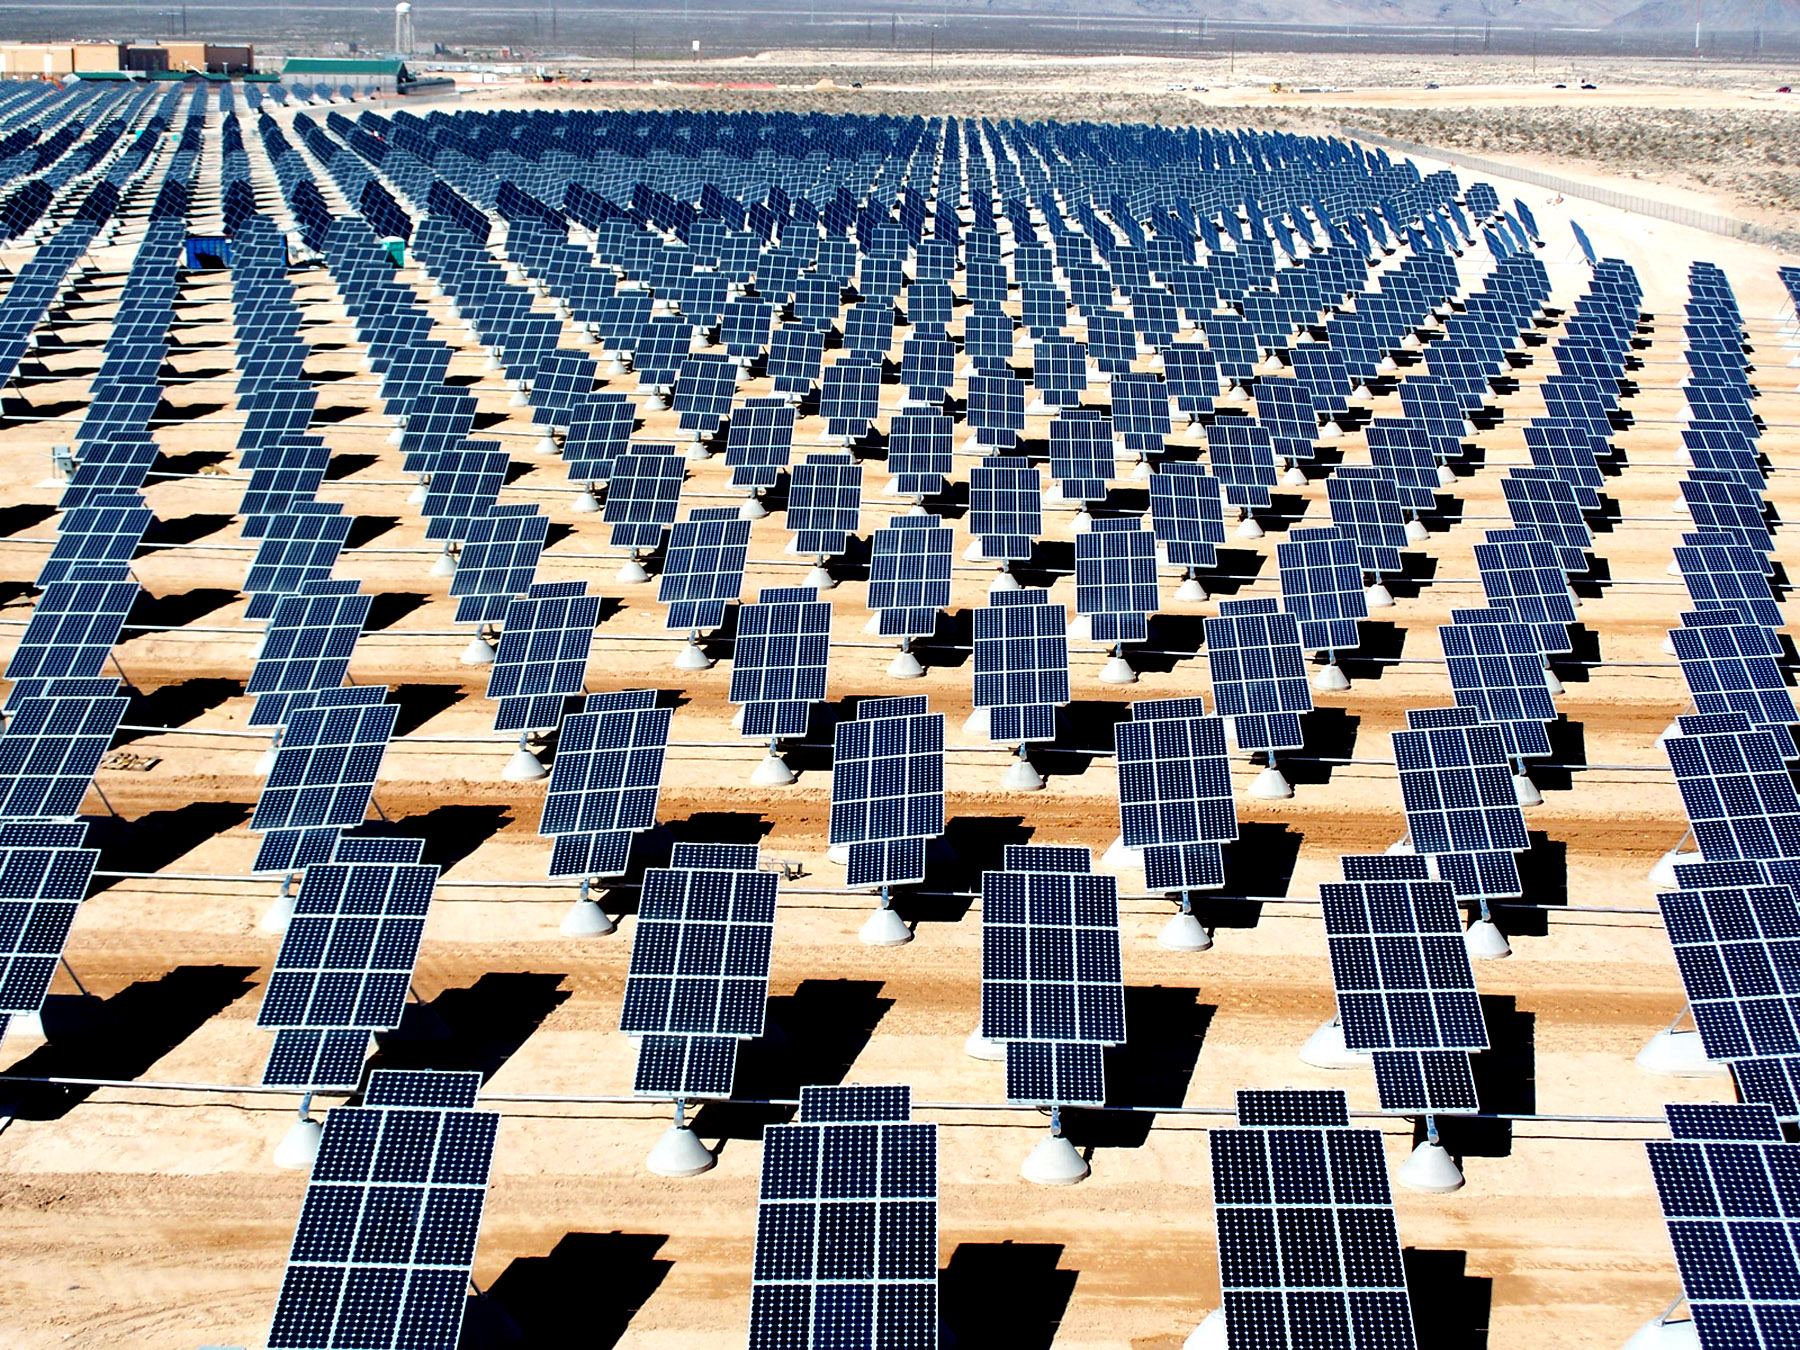
Figure 1: This image shows a large scale use of solar panels to create the use of solar energy. This is one way to go about mitigation as people propose to switch from fossil fuels towards cleaner and safer energy sources such as solar.
Link to IMAGE
Video about impacts of climate change
The video below talks about the impacts of climate change. More specifically it takes about the connection between climate change and the economy and how our economy is reliant on our environment. It is a very good and entertaining video that talks about the short versus long term effect of acting on helping improve the environment. It is very simple and has good connections and worth watching.
Link to the VIDEO
NASA on the impacts of climate change
NASA has a great website about the impacts of climate change. It talks a bit about the IPCC and their findings and study, but then goes on to list each continent and tell of the predictions for the future. Like in North America it is predicted that there will be an increase of rain fed agriculture, a decrease in snowpacks in western mountains, and longer hotter heat waves in areas that experience them.
Check out the other areas HERE
Check out the other areas HERE
NY Times article about present Climate change impacts
New York Times posted an article today May 6th about how climate change impacts are already showing. It talks about how there is more rain overall in the east, how hotter areas are getting hotter and seeing more droughts or wildfires, and how the mainly the Earth is getting warmer. It also has a nice picture showing the temperature changes overtime. This is worth a look as it is so relevant and recent.
The article is HERE
The article is HERE
EPA on Impacts affecting Human Health
The EPA is such a useful website and has a page dedicated to how climate change impacts can affect human health. This site lists off different possible factors resulting from climate change such as heat waves, extreme weather events, and air quality. These are all possible and the EPA goes through to talk about how things such as an increase in extreme weather events can affect the availability of fresh food and water as well as many other things.
To see all the possibilities go the EPA website HERE
To see all the possibilities go the EPA website HERE
Climate Change impact Depiction

Figure 1: This image is a very technical approach to showing the impacts of climate change. Its actually very good, because it not only lists off some possible impacts, but also shows how those impacts will specifically affect different areas such as humans and agriculture.
Link to IMAGE
Image of Impacts of Climate change
Figure 1: This is a visual approach to show the impacts of climate change. I personally enjoy these kinds of images more because of being just a visual learner. This is helpful in understanding and focusing a lot on hoe climate change impacts in water and oceanic aspects.
Link to IMAGE
Impacts of climate change

Figure 1: This image is a jumble of the impacts of climate change. This is interesting and lists a lot of aspects, but can be a bit hard to read. Still useful in understanding that the impacts are multilateral and not just only global warming or whatever.
Link to IMAGE
Video about making a Climate model
The video linked below is a news report about climate models. This talks about the process behind making a climate model. It shows some visuals about what they can predict and other aspects of climate models and that they are actually pretty reliable. Short and fast video but useful.
Link to VIDEO
Climate change Modeling Video
The following (below) is a video about the use of climate models to predict the future. It is a fairly lengthy video ~9 minutes that talks about generally what models exactly are used for, how they work, and how to make them. It talks about making the Earth into a grid to project areas and using formulas that help to understand the past and future of climate change and the Earth overall. This is a very good movie and is a general outline of the whole idea and use of models and is worth watching.
Link to VIDEO
Climate Change Model (graph)
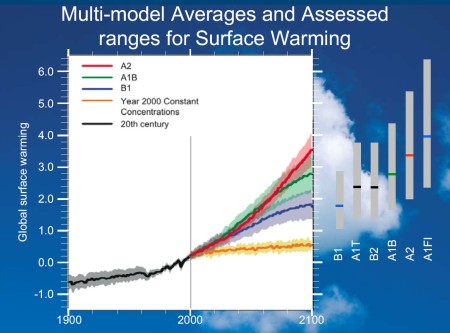
Figure 1: This is another type of climate model which uses hypothetical predictions of future behavior to map out ranges for surface warming over time. This shows 4 different models on the graph with lightly shaded areas to show the range of error involved with giving the predictions on surface warming for the next 100 years. This model goes well with the understanding of what these scenarios are, which can be found online.
Link to IMAGE
Climate Change Model

Figure 1: This image by the EPA is the estimated temperature rise up the the year 2100. There are two scenarios that are predictions based on our level of emissions within this time, either the lower possible which predicts at most 6 degree change and the higher which predicts up to 9 degree change. This is one style of a model which visually shows the change over time with a scale for the colors.
Link to IMAGE
Modeling EPA
The EPA website has a wide range of information of climate change, one of which is a page on Climate modeling. This has many different kinds of models some of which are directed at mitigation, such as their non-CO2 projections model which is based on sectors that are emitting greenhouse gases that are not carbon dioxide, which is useful in predicting how much different emissions affect change.
Check out the website HERE
Check out the website HERE
Future Climate
Most people wonder how we can predict climate change, to do so there are many ways, but it is important what these say. The EPA on their website has good notes about predictions of future temperature and precipitation/storm events and how they are projected to rise as our emissions stay the same. It also talks about future ice change, ocean acidification, and sea level changes, stating that ice is melting and there is projected to be a level in sea rise.
If you want to read the whole page click HERE
If you want to read the whole page click HERE
Ice Albedo Video
Here is nice short video about the Ice albedo feedback and is done by NASA. This shows how the loss of ice leads to more melting because water absorbs sunlight whereas the ice and snow reflects sunlight. Very short minute or so video and basically shows how snow has melted over time since it looks to be the ice age period or following that.
Link to video HERE
Feedback Video
The video below talks about feedback's in a short video which mentions the Ice Albedo effect. It talks about the process of feedback's and then goes on to discuss a bit about how this is being impacted by us and how we need to act to make sure this does not become a serious problem.
Here is a link to the VIDEO
Ice Albedo
The Ice Albedo feedback is a useful effect to know when talking about positive feedback's, because it is partly our fault. The ice albedo basically is how snow and ice reflect more sunlight, so as the snow and ice melt it leads to warmer temperatures and more melting which becomes a cycle. This is a well known area because we as humans are known to contribute to the greenhouse effect which may be a cause of the ozone hole over the Arctic causing some of this melting.
If you want to read all about the Ice Albedo effect visit this website HERE
If you want to read all about the Ice Albedo effect visit this website HERE
Feedbacks Image

Figure 1: This shows many different feedback possibilities and how they can affect the atmosphere. Such examples of this are the interactions between Ice and the atmosphere, also called the ice albedo effect where less snow or ice means warmer temperatures and leads to more melting. This is useful in showing many different feedback's and how the can interact.
Link to IMAGE
Feedbacks Examples

Figure 1: The following depicts two different feedback's, one being positive and the other being negative. The positive feedback is about the greenhouse effect and how it leads to increased temperature and more evaporation, then more water vapor is in the atmosphere which contributes to the greenhouse effect. The negative feedback is when there is an increase in temperature there is more evaporation and more low clouds reflecting more sunlight, thus decreasing the temperature.
Link to IMAGE
Climate Change Feedbacks
The following website linked below is useful for understanding the basics of feedback's involved in climate change. It talks about the two kinds of feedback's, positive which accelerates the effects of climate change and then negative feedback's which decelerates the effects of climate change. It mentions a big factor in positive feedback's which is melting ice and how the decrease creates less reflection as the snow and ice because of their color tend to reflect more light and lead to more heat and cause more melting.
To learn more about this topic visit the website HERE
To learn more about this topic visit the website HERE
Borneo Stalagmite Video
Watch this interesting video below about using stalagmites as a proxy record to find out about past climate and help with predicting the future. This is a short video but mentions how they use fallen stalagmites that have grown from the ground up and show changes in the past about rainfall and precipitation. This is very interesting and adds to where we can collect past climate data from, this is something I did not realize and found it to be something very interesting and make me want to research further. It also mentions a little about how they exactly extract the records, but not into too much detail.
Link to video HERE
Link to video HERE
Video: Tree ring Proxy records
A video I watched that was very helpful in understanding tree ring data and what it can tell us will be below. The video talks about the connection between how climate change can negatively or positively influence the social standing of certain places. The video focuses mainly on Europe and how during times of drought they saw the loss of crops and thus lead to a decline in population from famine or just failure to find profitability. This video is very good at explaining how using records like this can help explain past events which can hopefully help us tell the future to an extent.
Link to the video HERE
Video: Ice cores
The following video talks about the use of Proxy records, specifically ice cores. It talks about how this data can be used to find out what Carbon Dioxide levels were like up to hundreds of thousands of years ago. It shows how people actually work with ice cores, being able to tell seasons and specific years and the stories they tell, such as volcanic explosions and changes in levels of Carbon Dioxide. This is something that we watched as part of an assignment, but was very interesting to me as I have always been interested in ice cores, if you would like to watch click below.
Here is the link to watch the VIDEO
Proxy records: Ice Cores
Ice cores are one of the most effective methods of collecting proxy records for data about past climate records. This is due to the ability of them to capture gases during the time they freeze and then can later be extracted to measure concentrations of things such as Carbon dioxide and methane. The website below explains much of this and more, as well as listing some flaws with timing of ice core data. It also gives the different regions where ice cores are collected and explains how deep and good the regions are for ice core data, going from Antarctica to the Arctic.
Link to website HERE
Link to website HERE
Tree Rings as Proxy record

Figure 1: Many people know that you can tell the age of a tree through counting the rings, but some do not realize that those rings can also be used to tell the climate of the time. For example, thicker rings represent higher precipitation years as that tree grew more during that time. The downside to tree rings is that they are not as long living as some others such as ice cores and ocean sediments.
Link to IMAGE
Time use of different Proxy records

Figure 1: This depicts the span of how long each proxy record can pretty accurately predict the climate, so for example ocean sediments can tell millions of years into the past with good accuracy. It is also important to note that the thicker the most data is collected from. It is a good chart to get an idea of which records are good for which length of time since we have only had instrumental records for so long, and have collected data for shorter.
Link to IMAGE
Proxy records: What are they?
If you ever wondered why we are able to make predictions about what past temperatures and climates were like before we were alive then you should check out the link below about proxy records. It outlines 4 major proxy records that we use in tree rings, ice cores, ocean and lake sediments, and corals. Each of these have their own unique use in telling the story of past climates and this website gives a good description of why we use each. It also gives an explanation of what a proxy record is at the start, and is a good initial point to start if you want to learn more.
My personal favorite are ice cores, check it out HERE
My personal favorite are ice cores, check it out HERE
New York Times Nuclear Power Plant Article[4-27-14]
There was a recent newspaper article from the New York Times written around april 27 that talks about how phasing out nuclear power plants was not really a good idea. It gives the idea that it may die out before zero-carbon energy is completely introduced and that it is taken for granted when in reality it is falling out and may be irrelevant in the future. This is an interesting read for anyone interested in the use of nuclear power plants and how they are doing at the moment.
Read the article HERE
Read the article HERE
Greenhouse effect Video
Here is another video about the Greenhouse effect. It makes a good comparison to the greenhouses that we humans use to grow plants and compares it to the effect it can have on the Earth globally. It also gives some results due to the rising heat and the Greenhouse effect, very short but informative video for someone who wants a brief intro into the causes and how it works. Watch the video below.
Link to video HERE
How the Greenhouse Effect works
There is a short little goofy video that shows an animated way in which the greenhouse effect works. It gives a little insight into what will happen, but is a bit extreme. You can watch the video yourself below.
Link to video on YouTube HERE
Human activities that contributed to the Greenhouse effect
Linked below is a good resource to understanding what humans do that adds to the greenhouse effect. It lists the more well known ideas, being that humans burn fossil fuels that add carbon dioxide to the atmosphere and also transportation because it also burns gases contribute. This also lists facts that people may not know, things simple as deforestation adds to the effect, because plants and trees absorb carbon dioxide and some gases through photosynthesis. Also the fact that the way we use land adds to the effect, most obviously if we are building industry buildings it will directly add to the effect.
If you would like to view the list click HERE
If you would like to view the list click HERE
Greenhouse effect and Gases added over time

Figure 1: In this graph it can be seen that in the recent years and around the time of the industrial revolution the amount of greenhouse gases in the atmosphere sharply rose. This can be attributed mainly to humans and the industrial revolution where we started to use more coal and fossil fuels as energy and burned them which adds to the pollution in the atmosphere.
Check out the image HERE
Greenhouse effect Picture
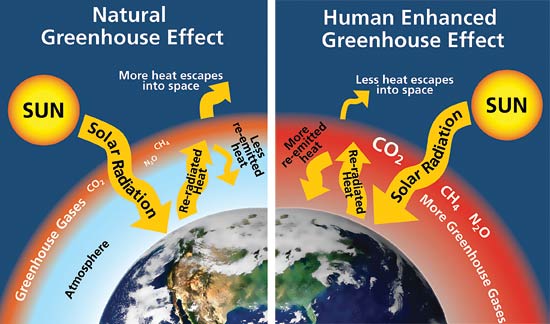
Figure 1: This image depicts the idea and way that the greenhouse effect works, where we add more heat to the atmosphere, as well as it causing less heat to escape into space. This generally exemplifies all parts of the Greenhouse effect and how humans contribute to this and cause a rise in heat more than one way other than simply adding these gases.
Link to IMAGE
Greenhouse Gases
When understanding the topic of Greenhouse gases it is important to understand the reasons it is happening and what does this mean to us as humans on the planet.The EPA website has a nice page giving a general and short outline of greenhouse gases. It charts the major greenhouse gases that affect the atmosphere and how they are produced. It also includes how long they stay in the atmosphere so it adds some idea of how quickly we have to react to change.
If you want to read the whole page click the link HERE
If you want to read the whole page click the link HERE
Comparisons of Different Energy sources
If you are thinking about what other options that we have compared to oil, coal, and other fossil fuels then I suggest looking at a comparison chart like the one linked below. In my opinion, I think Nuclear energy is actually a fairly good alternative looking at the benefits as being inexpensive fuel, does not cause or add to the greenhouse effect, and has the most compact waste of all sources. In your mind does this outweigh the cons, and also check out the other energy sources of coal, gas/oil, solar, wind, etc.
To make your own opinion check out the LINK to the webpage
To make your own opinion check out the LINK to the webpage
Graph about Cost of Energy Plants

Figure 1: This graph shows the operating cost of multiple energy plant sources ranging from solar to coal to nuclear to hydro-electric. This is useful in understanding that Nuclear energy is actually very cheap to make compared to what we use today, coal and fossil fuels. It also is a good comparative to other thought about options such as solar and wind energy.
Link to Photo
Process of Nuclear Energy
Nuclear Energy is just like any other energy plant in which it has to create heat to turn water into steam and get the plant to start a generator and in turn get the electricity we need. It actually has a neat little video player if you click on the image which gives a visual of the process. If you want to know more about the process or more in depth check out the website linked below.
Link to Webpage
Link to Webpage
Myths about Nuclear Energy
I read an interesting piece about the myths behind nuclear energy. It ranges from the beliefs about the accident in Chernobyl and that it can occur to us to the idea that Nuclear energy is bad for the environment. I think a lot of these myths are very surprising and should definitely be checked out by clicking on the link below.
Link to Myths
Link to Myths
Interesting Facts about Chernobyl
If you want to learn some facts about Chernobyl and the Nuclear accident you should watch this Video. It is a short video listing ten interesting facts about Chernobyl and the Nuclear accident. Some are pretty known ones such that the citizens of the area did not know about the first explosion until two days after. Then there are some that are very interesting and I am even unsure if they are true, find out and watch the video linked above.
Chernobyl Video
This video is a very quick and enjoyable video to watch if you are interested in the results of Chernobyl. It gives a brief description at the beginning of what happened, where it happened and then continues to show a slide show of photos from before and after of the Chernobyl accident.
Link to video HERE
Link to video HERE
Cherbonyl Nuclear Plant Accident in 1986
If you are like me then you would have been interested in Nuclear energy when talking about climate change, because personally I always thought it was the most dangerous and threatening way to create energy. After reading the facts about probably the most famous accident in Chernobyl, I realized that much of the reasons behind the accident had little to do with the fact of dealing with nuclear energy, and was rather due to design and human error. This page by the World Nuclear Association outlines in great detail all the reasons for the accident and the effects that occurred. The most important piece of information I learned is from the section about what has been learned from the Chernobyl accident.
Read for yourself HERE
Read for yourself HERE
Environmental Protectoin Agency Webpage
This website is a very good start if you want to educate yourself on the topic of climate change. It has many different areas to view from basic information about climate change to the science behind climate change and how it is happening. It also separates the United States into regions so you can be informed about your own specific area. Then, it has an area dedicated to the ways to help stop or mitigate climate change, specifically how to reduce the greenhouse effect and emissions, what they are doing specifically, and then what you can do individually to help contribute. It is a good general source to educate yourself.
If you want to learn more you can go to their WEBSITE
If you want to learn more you can go to their WEBSITE
Photo of Polar Bear in Melting Ice Area
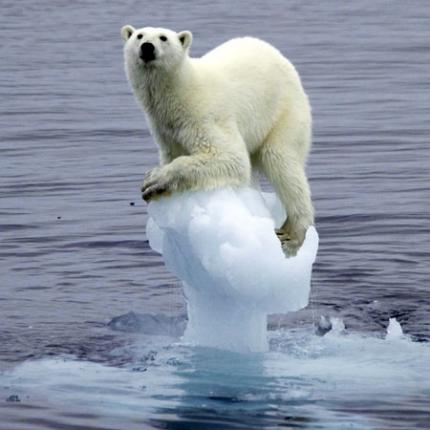
Figure 1: This is to me the universal depiction of Global warming, which is a result of Climate Change, the Greenhouse Effect, and the depletion of the Ozone [Ozone Hole]. If this doesn't make a person think that global warming or climate change is happening then they should do some research and this picture personally sparks interest in the topic of climate change.
Link to photo HERE
Cartoon drawing of Climate Change

Figure 1: This is one of the first photos I looked at when I started learning about Climate Change. It shows two different major ways that the environment can be affected from climate change, being extreme heat or more precipitation. It is interesting due to the fact that many think that Climate change is just Global warming from the Greenhouse effect, but it is actually more than that and this picture points that out nicely.
Link to photo HERE
Political Cartoon about who climate change is caused by and who it affects

Figure 1: This picture is a good description of why climate change matters. It depicts the larger industrialized nations who actually pollute causing climate change which is going to wipe out the more developing countries. This basically is true to some parts because as larger and wealthier countries we can afford to adapt whereas smaller developing countries are unable to with climate change. Its also important to note that certain areas are more susceptible to dangerous climate change and most are not in the countries that are causing, so it may not directly hurt us, but its a global issue not a personal issue.
Link to Image Here
Monday, May 5, 2014
Tuesday, April 15, 2014
Carbon Capture and Storage: The Myth?
Some flaws associated with carbon capture and storage:
- One flaw that comes with the idea of CCS is that it is economically straining, if there were a good way to develop this technology it would be very expensive, probably more so than to actually find more efficient ways of energy besides coal and other fossil fuels that are burned.
- Another flaw is that there is little true knowledge about how this technology works, and whether it would achieve its goal of reducing carbon emissions and how efficient it will be for reducing coal depletion.
- There is also the dilemma of trying to find locations to store this, because surely most people would not want it to be stored underneath their towns or cities and it is still questionable how much we can truly store.
- With this technology it could lead to the wrong assumption that with much of this carbon getting stored that they can use more coal, which during coal mining methane, another carbon based pollutant, is released and may not be as successful of an idea based on cost that they believed.
The Fatal flaw:
- The biggest issue that seems to arise from the discussion of CCS is the fact that there could be leakage and even with little release into the atmosphere can cause serious harm to species and would detract from the intended effect of reducing carbon emissions.
SOURCES:
http://www.rtcc.org/2012/10/02/carbon-capture-and-storage-time-to-bury-the-myth/
http://en.wikipedia.org/wiki/Carbon_capture_and_storage#Environmental_effects
Monday, April 7, 2014
Monday, March 31, 2014
Wednesday, March 26, 2014
Monday, March 24, 2014
Climate Change Past to Present
1. Based on the readings the general synopsis of the research is that the warming of the recent 1,500 years or so are unprecedented, meaning not that it is simply not consistent with the past patterns. The research used data from 73 temperature stations around the world and have been able to pretty accurately reconstruct the Earth's climate since the last ice age, and fairly well of the past ~11,300 years. The research shows that the Earth's temperatures have been warmer recently than it has been over that last ~11,300 years, approximately warmer than ~75% of the time period. The most critical piece of the paper examines future climate changes and projects that by the year 2100 the temperatures will exceed the previous maximums of the Halocene period under possible scenarios influenced by greenhouse emissions.
2. The three key findings of the study are as follows:
- Over the past ~5,000 years the Earth has cooled ~1.3 degrees F, but in the past ~100 years it has warmed ~1.3 degrees F (mainly in the North where more land masses and human life exists).
- The temperatures over the whole Halocene period are warmer now more than about ~75% of the last ~11,300 years, which is the span of human existence as far as we know.
- Finally, there is the prediction that temperatures will rise another 2.0-11.5 degrees F by the end of the century (the year 2100), saying that it is largely dependent on the amount of carbon emissions in the upcoming years.
3. They key graph shows the overall changes and prospective changes that have and could occur to our planet in terms of global temperature. There is a clear sign that the temperatures have decreased previous to the current period, but now there seems to be a sharp increase heading into this century. The projections are also shown and is visible that the temperatures are expected to rise past the highs of the Halocene period, within the century.

Figure 1:Information above explains the graph.
4. Michael Mann argues that the take home point of the study is that the rate and magnitude of recent global warming is unprecedented in the past ~4,000 years, and in the past ~11,000 years the rate is unprecedented. This means that there is a noticed increase that not only seems to be going past the highs of the past, but also that the rate at which the temperature is increasing is something so sharp that has not been seen before, and could be rising to levels higher than ever before.
5. Robert Rohde expresses concerns for the magnitude of the warming based on the study. He says that the magnitude of the estimated warming is slightly larger than he had previously believed and that this can be useful when trying to understand and learn the past magnitude of changes and how forcing and other factors work in affecting global warming or change. He does have one issue with the study finding that the high frequency variability is suppressed and therefore it is hard to make connections and comparisons between rapid changing events like the warming in the past century.
6. Richard Alley says the big picture of the study is that we want to know if past warming or cooling was natural and if the changes of temperature were faster or slower than previous. He says that the recent changes do not necessarily project the changes now perfectly and if there were an error in determining the past changes, then it could affect our predictions to either be better or worse than what could actually occur.
7. Roger Pielke Jr. says that the data was grossly misused in terms of representing the data to the public. In the graph above there is a spike in the data since about the 1900's, but Pielke says that anything past 1900 cannot be concluded. This graph makes predictions which is not data and can be quite misleading, so he suggests that we fix the mistake to not include the spike until we actually have conclusive data to support such predictions.
Wednesday, March 19, 2014
Poster designs
http://www.kumc.edu/SAH/OTEd/jradel/Poster_Presentations/PstrStart.html
The link above is a good source to go through step by step process of what is useful to be included onto poster presentations and what is not needed. Right from the start it gives a basic layout of a poster idea, and the reading is small and easy to navigate through and with good visuals to see rather than just read or hear another person say this is good and this is bad. It actually gives good visuals to either base ideas off of or to just use in bits and pieces as someone would do their own project.
abacus.bates.edu/~bpfohl/posters/
I really think this second link is useful specifically to us, because it caters to the use of PowerPoint in making a poster presentation. It gives little details that are helpful to make a poster look professional and to make it look as though there were actually time put into the project.
What causes Ice Ages?
It seems from the readings that ice ages are caused by many things, including Carbon dioxide and methane concentrations, changes in the Earth's orbit around the sun (Milankovitch Cycyles), and the motion of tectonic plates resulting in the relative location and the amount of continental and oceanic crust on the Earth's surface. Most of the issues begin with the idea that the Milankovitch cycle creates a period, in the North, that causes snow to not melt in the summer time from previous seasons. This is caused from lower than needed temperatures and as this cooling happens snow accumulates and keeps continuing up until it reaches areas that are warm enough for it to melt. As the snow is unable to melt it causes Carbon dioxide levels and temperature to decrease causing a period in which the cold only exist, from not enough heat getting trapped and instead reflected by the snow and becomes huge ice sheets that cover a mast amount of the Northern continents. There are of course other influences, such as winds taking water vapor to lower latitudes and ocean currents taking warmer water lower as well, but the main ideas behind the cause of an ice age are the period listed above.


Figure 1: This shows how ice ages can occur,more specifically the Milankovitch cycle. The Earth axis tilt over time and at points when the North or south is as far away as possible there comes the point when temperatures fail to reach a critical value to melt the ice and snow.
Monday, March 17, 2014
Tipping Points
One such tipping point listed in the Kerry paper was the runaway greenhouse effect, which talks about an increase of water vapor in the air leading to the oceans and water sources to dry up from increased heat and the cycle that would keep going until the earth was waterless and the heat created would cause the effects of an inferno, basically too hot for human life.
Another is the idea that the more snow that develops and spreads across the Earth will cause more heat and sunlight to be reflected back and would increase the amount of ice and snow covering the Earth until it is completely covered and there is no heat getting in to melt the snow and ice. A recent theory kind of shuts down this idea saying that without any water carbon dioxide could not be absorbed and the greenhouse effect would eventually melt the snow and ice.
One thought about a tipping point in the oceans was mentioned in Sanders' article and said basically that changes in temperature and acidity in oceans could cause a tipping point for coral reef ecosystems causing the cycle to change drastically or completely fail.
He also mentions in that article that melting in Antarctica can lead to a rise in sea and ocean temperatures as the increase in heat creates more melting of ice. The more water and less snow and ice would result in more warming, because of more sunlight absorption by water as compared to snow and ice.
Then the Levitan article talks about more of a domino effect stating that the melting in the Arctic could cause a rise in temperature and spread down northern continents creating a domino effect of increased heat started from the Arctic. Although most have said there is no clear evidence to predict that there is a tipping point for sure, they do not want to rule it out and feel that something should be done such as trying to reduce our emissions, to lessen our effects on the greenhouse effect.
The ones that seem to be the most likely to occur in recent years are the two mentioned by Sanders, being that the sea levels could rise, it states by up to 3 feet by 2200, and our heat from emissions needs to be reduced to stop this and coral reef ecosystems. Then, Levitan's domino effect is more of a slow change, but says there could be a point of no return which we simply cannot guess exactly at this point. Finally, the two extremes of the fire and ice world, seem to be not really something that could happen soon, but it does get people to think that ok this in theory could happen so lets not try and push it past a point of reversing.
Reliability: I think all these articles are quite reliable and list many of the same scientists, some being known as leading scientist, others were still well respected. So overall they were good sources.
http://www.scientificamerican.com/article/do-global-tipping-points-exist/
http://newscenter.berkeley.edu/2013/12/03/report-warns-of-climate-change-tipping-points-within-our-lifetime/
https://docs.google.com/file/d/0B5OYZdqOzxSLa3hSdE9GX0FycFE/edit
Tuesday, March 4, 2014
Post About Connection of Climate Change and Extreme Weather Events
The question is, what is the
connection between climate change and extreme weather events and disasters?
I would answer this question by first pointing out there is no direct evidence to prove that the increase in temperature is the ONLY cause for an increase in extreme weather events (i.e. heat waves, hurricanes, forest fires, etc.). From reading and watching videos about this information it seems though that there is a bit of a consensus to say that the increase in temperature globally leads to extreme weather events to become more likely to occur. Meaning that the increase in temperature makes it such that areas that already had forest fires, that are now hotter because of global warming, are more prone to get a forest fire. The sources that I got from touched upon the idea that climate change is so hard to connect to extreme weather events, because fires are a few steps removed from simply a temperature rise and is hard to show a direct connection. There is also an idea that climate change can also cause the cold extremes, such as increased snow, but the fact still remains there is no direct link that we can be positive to make such a call. A good way to look at the scenario would to be to compare it to studying for an exam. Take for example someone who reads the book assigned for a course. You would think that a person who does all the work is going to get a good grade, there is an assumption that doing the work increases your chances of getting a good grade on an exam. Except the fact still remains there is no way to assure that doing all the work will get that good grade, just like with climate change and extreme weather events. We notice that the increase in climate change is also caused some increases in extreme weather events, but you cannot make the assumption that it is a DIRECT cause without proof, same as you cannot say that simply reading will get you good grades(other factors like applying ones' self are important). Finally the last answer of who is Kevin Trenberth is answered by saying that he is a lead scientist that is part of the Climate Analysis Section at the USA National Center for Atmospheric Research. He is a Atmospheric scientist as well as a meteorologist that was the lead author of the IPCC Scientific Assessment of Climate Change 3 different years(1995, 2001, 2007).
Sources used:
- Based on what you just saw and read - how would you answer this question?
- What are the connections? Does it even matter?
- Is there a good analogy you can use to illustrate the connections?
- And - who is Kevin Trenberth?
I would answer this question by first pointing out there is no direct evidence to prove that the increase in temperature is the ONLY cause for an increase in extreme weather events (i.e. heat waves, hurricanes, forest fires, etc.). From reading and watching videos about this information it seems though that there is a bit of a consensus to say that the increase in temperature globally leads to extreme weather events to become more likely to occur. Meaning that the increase in temperature makes it such that areas that already had forest fires, that are now hotter because of global warming, are more prone to get a forest fire. The sources that I got from touched upon the idea that climate change is so hard to connect to extreme weather events, because fires are a few steps removed from simply a temperature rise and is hard to show a direct connection. There is also an idea that climate change can also cause the cold extremes, such as increased snow, but the fact still remains there is no direct link that we can be positive to make such a call. A good way to look at the scenario would to be to compare it to studying for an exam. Take for example someone who reads the book assigned for a course. You would think that a person who does all the work is going to get a good grade, there is an assumption that doing the work increases your chances of getting a good grade on an exam. Except the fact still remains there is no way to assure that doing all the work will get that good grade, just like with climate change and extreme weather events. We notice that the increase in climate change is also caused some increases in extreme weather events, but you cannot make the assumption that it is a DIRECT cause without proof, same as you cannot say that simply reading will get you good grades(other factors like applying ones' self are important). Finally the last answer of who is Kevin Trenberth is answered by saying that he is a lead scientist that is part of the Climate Analysis Section at the USA National Center for Atmospheric Research. He is a Atmospheric scientist as well as a meteorologist that was the lead author of the IPCC Scientific Assessment of Climate Change 3 different years(1995, 2001, 2007).
Sources used:
Feebacks
The ice-albedo feedback is the system in which snow and ice reflects back more sunlight and heat than other surfaces, therefore cooling an area, but when this ice melts it in turns is reflecting less heat back. So when the ice melts in an area such as the Arctic it will inevitably cause more ice to melt, because more heat will get trapped in the area than before and cause a trend of ice melting. Not only can heat from the sun cause this effect, but also human heating and other processes of creating heat can cause ice to melt and lead to more ice melting.
Source: http://www.metoffice.gov.uk/climate-change/guide/science/explained/feedbacks

Source: http://www.metoffice.gov.uk/climate-change/guide/science/explained/feedbacks

Figure 1: This separates the latitudes into three regions. At the higher latitudes you see a constant polar season, where the temperature is cooler, opposed to the central tropic region where it is consistently wet and dry and warm.
Ice Cores
Ice cores are a useful tool in predicting the past climate change. One such reason for this is that when the layers of snow fall down they trap the dust, sea-salts, ash, gas bubbles and human pollutants of the past underneath and it freezes over. The important part is that it traps all of this so we can later examine the inside chemical makeup to figure out these concentrations at separate periods. The deeper you dig to retrieve an ice core the longer period of time you can see variation of weather periods and what the area was like in the past. An important piece of information gathered from these ice cores though is the water isotopes that are known to have relationships with temperature and are good predictors at determining past temperatures beyond our records. The ability of these ice cores to trap substances and chemicals is key in helping figure out climate change, and the fact that they are layered so well helps determine time periods and how these periods changed in climate. For example salt concentrations are associated with higher winds, similar to how the water isotopes are associated with temperatures.
Source: http://climatechange.umaine.edu/icecores/IceCore/Ice_Core_101.html
Source: http://climatechange.umaine.edu/icecores/IceCore/Ice_Core_101.html
Ocean Sediments
1. Ocean sediments are special, because they can be used to find out climate change of water surfaces of oceans and of areas on continents next to these oceans.
2. Ocean sediments are good for predicting the climate of past surface water temperatures, salinity, dissolved oxygen and nutrient availability. Also using inorganic materials found in ocean sediments can be used to find information about continental humidity-aridity variations and intensities/directions of winds.
3. Things that set Ocean sediments apart from other proxies is that there are billions of tonnes found on ocean basins every year, so there is almost always availability to this source.
4. The areas that Ocean sediments truly excel is in coastal continental areas and finding out surface temperatures in the surrounding waters, these sediments are good for determining climate change of these locations. They are also able to help find these changes from ranges of thousands of years all the way to ten million years in the past.
5. Ocean Sediments would prefer to work in areas that are coastal, such as off the coast of California, Alaska, Australia, and basically anywhere that has a surrounding area of water that has sediments for study.
Source: http://www.global-climate-change.org.uk/3-3-4.php
Monday, March 3, 2014
Quatrenary Period
The Quaternary Period is classified by the series of glaciations there have been and also the increase and development of what are anatomically modern day humans. The first is basic, but to explain it a bit I would say that this period has had periods of increased and decreased coolness and glaciation. The period we are in now expanded from approximately 2.5 million years ago to today, and only today are we seeing things that were not the norms of previous years. For example, there have, as it seems, always been shifts between glaciers forming in northern Arctic and the southern Antarctic, but in periods of more cooling we see the expansion of these glaciers. Then when the period comes to an end we see the rise in temperature, which lasts roughly 10,000 to 15,000 years, known as interglacial periods. Not all areas though were getting more glacial or less, some areas were characterized by more precipitation or less, and same for snow. The one blip, if you wanna call it that, which we see in the temperature is more recently, where there is a notice of pretty drastic rising in temperature and Carbon Dioxide levels. This period otherwise has been fairly consistent in glacial expanding and retracting, but the fear that many have is that humans affect the environment in such a way that alters climate drastically.
Sources: http://science.nationalgeographic.com/science/prehistoric-world/quaternary/
http://qra.org.uk/about/quaternary
http://en.wikipedia.org/wiki/Quaternary

Sources: http://science.nationalgeographic.com/science/prehistoric-world/quaternary/
http://qra.org.uk/about/quaternary
http://en.wikipedia.org/wiki/Quaternary

Figure 1: This is a graph depicting the current Quaternary Period that we are in, spanning over the last 2.5 million years. Notice how the trends of glacial and interglacial periods are distinct with the rising and decreasing temperatures, but with more recent years staying warmer.
Ice cores and predicting past Climates
Ice cores to me seem to big a common data collection tool for how climate was in the past, especially for the Antarctic and Arctic. Theses cores are collected with a tool to extend down farther into ice structures to get a longer period of climates. These cores leave in them stored gases and other concentrations of sediments that can be used to explain the climate of that region a certain number of years ago. For example, if there is dust and sediment from volcanoes, then they can make a prediction that a volcano erupted a certain number of years in that region where the ice core was collected. Not only do they help tell the temperature, but they also can give us estimates of rainfall and snowfall during certain periods. All of these is good if we ever want to make a real change, because of any finding that shows we are causing the changes in climate that are far off from the norms of the past.
Sources: http://en.wikipedia.org/wiki/Proxy_%28climate%29
http://www.ncdc.noaa.gov/data-access/paleoclimatology-data/datasets/ice-core
Sources: http://en.wikipedia.org/wiki/Proxy_%28climate%29
http://www.ncdc.noaa.gov/data-access/paleoclimatology-data/datasets/ice-core
Questions to Raymond Bradely
If i were to ask him two questions they would go as the following:
1. With how much confidence can you tell me that ice cores and other artifacts can be used to accurately measure climate change?
- I would want to know this, simply because everyone says they can predict the past using ice cores and other cores, but how can anyone be sure if they were never actually there.
and 2. In your personal opinion are human factors truly harming the environment and how much do they deviate from norms?
- This is important to me, because if he cannot answer the above question then this would at least give me and understanding that they have some facts to say so. Without facts most scientists would not give an opinion or even speak on an issue.
Reponses to short videos
First video - The take home message from this short video is that we can use ice cores to measure tends of temperature and Carbon Dioxide levels before our data collection,and looking at today our Carbon dioxide levels are higher than ever and needs to be noticed if humans are negatively affecting the environment.
SOURCE: http://www.youtube.com/watch?v=oHzADl-XID8&feature=youtu.be
Second video - For this video i think the biggest point they made was that using chemical make up of cores can help get a fairly good idea of climate before our data collection, and even with the possible error of using cores we still see a rise in temperature now that may be out of the normal range that has been experienced over time.
SOURCE: http://www.youtube.com/watch?v=PfjkeE-ABGI&feature=youtu.be
Third video - In this video it talks about diatoms, which is basically collected from the soil at the bottom of lakes and water sources. These are used to see changes in theses diatoms over time and how they change when the climate and temperature change, but are focused on seeing over time how the changes are related to climates over time and the big picture.
SOURCE: http://phys.org/news/2013-11-diatom-algae-populations-story-climate.html
Sunday, March 2, 2014
About Paleoclimatology
Paleoclimatology is the study of climate prior to the availability of recorded data. It is studied similar to that of archeologists, but instead of using dinosaur and fossils, this data is collected through footprints left by the environment about past climates and climate trends over the years. It is important to study mainly, because we need to learn if the climate changes that we have been able to study are due to natural variations over time or whether we as humans are affecting the climate negatively.
Sources used:
http://www.ncdc.noaa.gov/paleo/primer.html
http://earthobservatory.nasa.gov/Features/Paleoclimatology/paleoclimatology_intro.php
Sources used:
http://www.ncdc.noaa.gov/paleo/primer.html
http://earthobservatory.nasa.gov/Features/Paleoclimatology/paleoclimatology_intro.php
Wednesday, February 26, 2014
Response to "Missing Heat" article
SOURCE : https://docs.google.com/file/d/0B5OYZdqOzxSLdjZ6X0R4S0ZfX1E/edit
This article is interesting and points toward ocean temperature shift in the tropical pacific as being a main factor for the cooling period between 1940-1975. They point to the effects of El Nino and La Nina to explain that the cooling and warming in these regions coincide with the periods of global warming and cooling on the Earth. This source does not seem as reliable as the other one, because this one says there are also skeptics and also points to the aerosol's as another possible reason for cooling and heating. As for the hiatus after 1998 this article points towards warming in the deep ocean during this period and that we seen warmer surface temperatures during periods of extreme heating. Jeff Tollefson covers climate, energy, and the environment for Nature, which is the article described above.
This article is interesting and points toward ocean temperature shift in the tropical pacific as being a main factor for the cooling period between 1940-1975. They point to the effects of El Nino and La Nina to explain that the cooling and warming in these regions coincide with the periods of global warming and cooling on the Earth. This source does not seem as reliable as the other one, because this one says there are also skeptics and also points to the aerosol's as another possible reason for cooling and heating. As for the hiatus after 1998 this article points towards warming in the deep ocean during this period and that we seen warmer surface temperatures during periods of extreme heating. Jeff Tollefson covers climate, energy, and the environment for Nature, which is the article described above.
Tuesday, February 25, 2014
Response to SkepticalScience Post on Mid 20th Century Cooling
SOURCE : http://www.skepticalscience.com/global-cooling-mid-20th-century-advanced.htm
This source seems to make a reasonable point about the direct and indirect effects of aerosol's on our atmosphere, but I cannot be a good judge of reliability unless I hear many others saying the same thing. It mentions that the release of sulfates into the atmosphere during that period is most likely the cause of the cooling effect, being the largest period in which they were released into the atmosphere. This article is only about 3 and 1/2 years old, which can have changes in a period like that. One thing that stands out to me is that we see a similar plateau after 1998 when there was an agreement to stop releasing these greenhouse gases into the atmosphere. The effect seems to be similar, but the causes are very different, one period a massive increase in sulfates and aerosols and the other an attempt to phase out and decrease all pollutants and greenhouse gases.
This source seems to make a reasonable point about the direct and indirect effects of aerosol's on our atmosphere, but I cannot be a good judge of reliability unless I hear many others saying the same thing. It mentions that the release of sulfates into the atmosphere during that period is most likely the cause of the cooling effect, being the largest period in which they were released into the atmosphere. This article is only about 3 and 1/2 years old, which can have changes in a period like that. One thing that stands out to me is that we see a similar plateau after 1998 when there was an agreement to stop releasing these greenhouse gases into the atmosphere. The effect seems to be similar, but the causes are very different, one period a massive increase in sulfates and aerosols and the other an attempt to phase out and decrease all pollutants and greenhouse gases.
Sunday, February 23, 2014
Climate Change Survey Questions and Responses
Link to the Survey questions for "Science of Climate Change"
Link to responses of questions for "Science of Climate Change"
Link to responses of questions for "Science of Climate Change"
Response to "Climate Bathtub" Carbon Dioxide cycle model
The "Climate Bathtub" is an important visual tool in understanding how the carbon dioxide in our atmosphere is transferred in as well as flowing outward. The image really puts into perspective the basic idea that there is a flow inward of carbon from natural sources, such as respiration and decay of plants and human causes like burning of fossil fuels. Then, compared to the outward natural flow in processes such as, photosynthesis and dissolving into oceans reflects the amount of Carbon dioxide floating around in the atmosphere. One of the underlying concepts is that there is an uneven flow of carbon dioxide into our atmosphere, because there is the one natural source causing a rise balances with the natural causes that release carbon dioxide. Except, when including the human causes that add to the rising levels and create an imbalance, causing more inflow than outflow. Some of the excess can be absorbed by the plants and oceans, but there is such a increase from humans that we should seriously look at our impacts. An important thing to notice throughout all of these examples is that there is always an increase of Carbon dioxide into the atmosphere as long as humans continue to add to the levels, but if we can somehow have no inclusion in adding to the carbon dioxide levels then there is a hope to avoid reaching an overflow that can drastically harm the atmosphere and humans health.
Link to the "Climate Bathtub"
Link to the "Climate Bathtub"
Wednesday, February 19, 2014
Opinion on video "What's the Worst that can happen?"
My simple opinion from watching this video is that he may have a point not the extreme ones that he puts into his chart, but the fact that we need to spread the word. I mean when has doing nothing caused something good to actually happen, the key word being good, because yes it may be the right thing and result in not doing something unnecessary although is not accomplishing anything new. For example he points out that if we do nothing and there is no Global warming that we are happy, yes we may not see our world destroying as fast as we think, but there are still definitely problems associated with us causing Ozone depletion and increasing other risks besides Global warming such as harming agriculture and increased risks of disease or skin cancer. So my take from the video is that he may scare a lot of people with his take that the world as we know it may end in decades, I think his biggest point is that we need to spread the word and get people thinking, because no action (in my opinion) is worse than a wrong action.
LINK to the video.
LINK to the video.
Top 3 Facts about Ozone Information
TOP 3
1.) One of the biggest things I learned from reading this paper about good and bad Ozone is that I should limit my strenuous activities at the times when the bad Ozone levels peak, which is around mid day (10 AM-4 PM). I knew the sun was an issue then, but i did not know the reason behind and this was informative to me.
2.) I also knew that the bad chemicals are what is causing holes in the protective Ozone layer, but the important part that I saw was that it was estimated by scientists that one chlorine molecule can destroy about 100,000 "good" Ozone molecules.
3.) My final interesting point that i did not know was that these increases in "bad" Ozone at ground level can hurt crops and plant life by reducing growth and survivability, and is said to reduce crop growth as much as $500 million in production. Which is a large number to be harming with something we as humans are contributing to as well.
All facts from this LINK.
Tuesday, February 18, 2014
Wednesday, February 12, 2014
Fixing The Communications Failure Response Post
- Cultural Cognition is the development that a person makes to one group adopting their preferences and ideas, that can be political or scientific. For example if you are a firm believer in God you will probably not accept many scientific theories of how the Earth was created even with sound evidence because you want to stick with the ideas of your own cultural group.
- Protective Cognition, which is about holding onto ones own values by finding professional evidence to reinforce their ideas, is very common in climate change, because we often hear the earths climate is changing and when we all want the same goal, some agree for drastic change and others think simpler solutions are the answer.
- One way he recommends to improve communication is to present scientific evidence in a way that does not threaten ones own values, and instead put it in a way they agree with to keep them open minded. The other option is to make sure that scientific data is agreed with by a diverse group of scientists and there is not as much combating ideas which often split people who show preference toward certain evidence, because of the person.
- The issue that most scientific data is that we are given so much information about the topic and assumed that we will interpret the data in a well thought out manner, but the truth is that other factors affect our opinions and some people being less open minded may jump to the first conclusion they see even with all this information. Others who already have an opinion might see much dissenting opinions and be so resistant and lean even more toward their opinion, because they disagree with the total opinion not simply the facts.
Decision Grid (with Photo)

My Decision Grid for Nuclear Power
My thinking process was very simple, if we did build it those who wanted a plant would be saying it gives us this good alternative that does not hurt our environment. On the other hand those proposed to the idea would be quick to point out any accidents with waste or explosions or whatever it may be. Then if we did not build it we can make guesses, but will truly have never known.
Sunday, February 9, 2014
Wednesday, February 5, 2014
Monday, February 3, 2014
Article from NY Times - About Being a Scientific Advocate
http://www.nytimes.com/2014/01/19/opinion/sunday/if-you-see-something-say-something.html
Michael E. Mann is director of the Earth System Science Center at Pennsylvania State University and the author of “The Hockey Stick and the Climate Wars: Dispatches from the Front Lines", and is the author to the above article. James Hansen is former director of the NASA Goddard Institute for Space Studies, and an activist who has been arrested multiple times for protesting things such as, the Keystone XL pipeline from Canada to the Texas Gulf. He also has released a paper basically saying that we need to reduce our fossil fuel emissions rapidly if we are to stop the bad pattern in climate change. Steven Schneider is a former colleague of Michael Mann and worked at Stanford University was an advocate for promoting change for scientific facts studied and not needing to be completely quite about speaking out, he passed away in 2010. This article starts off discussing that Climate Change should not be a debated issue and that it should be recognized by all as an issue to move forward and create change.It basically discussing whether, because one is a scientist should they just do their research and not be outspoken about the implications, but he doesn't believe this is a radical view simply that Scientists are citizens as well and should be able to express their discoveries.
Michael E. Mann is director of the Earth System Science Center at Pennsylvania State University and the author of “The Hockey Stick and the Climate Wars: Dispatches from the Front Lines", and is the author to the above article. James Hansen is former director of the NASA Goddard Institute for Space Studies, and an activist who has been arrested multiple times for protesting things such as, the Keystone XL pipeline from Canada to the Texas Gulf. He also has released a paper basically saying that we need to reduce our fossil fuel emissions rapidly if we are to stop the bad pattern in climate change. Steven Schneider is a former colleague of Michael Mann and worked at Stanford University was an advocate for promoting change for scientific facts studied and not needing to be completely quite about speaking out, he passed away in 2010. This article starts off discussing that Climate Change should not be a debated issue and that it should be recognized by all as an issue to move forward and create change.It basically discussing whether, because one is a scientist should they just do their research and not be outspoken about the implications, but he doesn't believe this is a radical view simply that Scientists are citizens as well and should be able to express their discoveries.
Richard Alley Speaker at Seattle Science Festival - Opinion
http://www.youtube.com/watch?v=7aS6S-lCRSI
I think some important points that Richard Alley makes is that when we look at climate change data it cannot be from just a short period, say under 10 years, because these trends may show cooling but overall the global temperature is rising. He also points out Carbon Dioxide rising is a cause and is created by human burning fossil fuels into the atmosphere. Finally, a huge point I think he makes is that we need to learn how to use our resources wisely before we burn them all away. One question that i would want to ask to him would be, Since we are burning our resources faster than they are coming, what kind of developments are we making to change how we use and not burn those resources? Richard Alley is a Professor at the Pennsylvania State University, he is a member of the National Academy of Sciences, has studied ice cores up to two miles deep, and is a highly respected scientists. He also is a recipient of the Noble Prize, along side Al Gore for their efforts into studying and presenting issue of climate change.
I think some important points that Richard Alley makes is that when we look at climate change data it cannot be from just a short period, say under 10 years, because these trends may show cooling but overall the global temperature is rising. He also points out Carbon Dioxide rising is a cause and is created by human burning fossil fuels into the atmosphere. Finally, a huge point I think he makes is that we need to learn how to use our resources wisely before we burn them all away. One question that i would want to ask to him would be, Since we are burning our resources faster than they are coming, what kind of developments are we making to change how we use and not burn those resources? Richard Alley is a Professor at the Pennsylvania State University, he is a member of the National Academy of Sciences, has studied ice cores up to two miles deep, and is a highly respected scientists. He also is a recipient of the Noble Prize, along side Al Gore for their efforts into studying and presenting issue of climate change.
Sunday, February 2, 2014
Climate Change and NY Times Cartoon Explanation

The about cartoon is about the status quo and climate change, on left side we have those saying we need to do something about our current state of climate change and are trying to change the status quo, and then on the left hand side we have the people who do not want to change their ways and are opposing the forces that those who want to change the status quo on climate change and saying so making it harder to actually get something accomplished. I think the overall statement is talking about how we all need to work together towards a common goal about climate change or we will never accomplish nothing.
Subscribe to:
Comments (Atom)