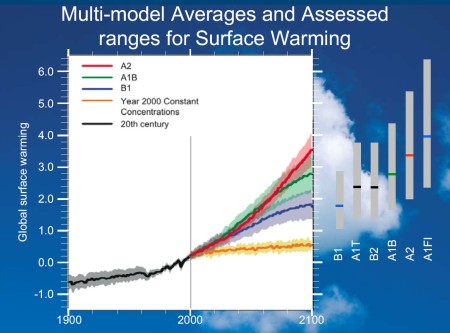
Figure 1: This is another type of climate model which uses hypothetical predictions of future behavior to map out ranges for surface warming over time. This shows 4 different models on the graph with lightly shaded areas to show the range of error involved with giving the predictions on surface warming for the next 100 years. This model goes well with the understanding of what these scenarios are, which can be found online.
Link to IMAGE
No comments:
Post a Comment