Wednesday, May 7, 2014
Tuesday, May 6, 2014
Climate change solutions video
Below is a video about the solutions to climate change and a general outline of what they think the solutions are that we should be doing. It talks a lot about solar energy and the pros and cons such as the prices and the ability to use them only with sunlight. It takes also about how it will cost more money up front, but in the long run it will be a clearly better option. Why are we not switching then?
Watch the video HERE and make a judgement for yourself.
Watch the video HERE and make a judgement for yourself.
Laws for Climate change
Below is a link to California's Global Warming Solutions Act. This bill outlines a plan to reduce emissions going into 2020, such as requiring industries to report on their emissions. This is an overall good law, but we will have to see how well they execute and plan to continue after the act is technically outdated.
Link to Bill 32 HERE
Link to Bill 32 HERE
Timelapse of deforestation
Below is a video by NASA just showing what deforestation looks like over a period of time. Just something fun to watch.
Link to VIDEO
The science of Deforestation
Here is an article about the science of deforestation and how it works. This article goes through all the different reasons why deforestation occurs such as logging and agriculture. It talks about how the main issue is in Brazil and the Amazon because it is being removed at an alarming rate. This is very thorough and goes through many different causes and then talks about solutions.
Link to article HERE
Link to article HERE
Photo of Deforestation

Figure 1: This shows deforestation and how it adds to the emissions of Carbon Dioxide, due to a lack of absorption if there are less tress. It also lists at the bottom some reasons for deforestation, which I think we need to look at and see if we can alter or stop to either stop deforestation or reduce it by a good amount.
Link to IMAGE
Deforestation and Climate change
There is a nice report on the effects of deforestation on climate change and how it actually contributes to climate change more than we may think. It talks about how deforestation releases 1.5 billion tonnes of carbon dioxide each year, which is an alarming number. It also says that it is a whole 20% of the carbon emissions caused by humans, which to me is surprising because of how much we think can cause a rise in carbon emissions. This is a really good article that also talks about how if we continue what our future could look like.
Read the article HERE
Read the article HERE
Solutions to Climate change

Figure 1: This shows simple things that we can do to help the environment. This ranges from recycling to more proactive things such as lowering thermostats when we are not home as to waste electricity, that statement that is widely known.
Link to IMAGE
Wind energy Video
Below is a simple video about wind energy and the turbines that are used to create the energy. It goes into the specifics of how a turbine works, from how the outer wings spin to why they are created so tall. It also talks about how they have gears inside to increase rotations to create enough energy to power a generator. Very informative and simple to understand.
Link to the VIDEO
Wind energy Pros and Cons
The duke university website has a nice paper outlining the pros and cons of wind energy. It talks about the obvious pros such as it is renewable, safe and will be around for a while. While the cons it talks about the limitations such as not being able to put them anywhere because not everywhere gets enough wind to power these. It is a good way to compare if you wanted to build a stance.
Check out the website HERE
Check out the website HERE
Wind Energy article
There is a nice idea called wind energy that is a renewable and safe option to get energy. On the website linked below it talks about how specifically wind energy is collected through very tall turbines that are rotated through strong winds. It mentions how they can be stand alone energy sources or can be hooked up to grids that can transfer that energy. This is a good simple read to understand basic wind energy.
Link to website HERE
Link to website HERE
Photo showing Wind energy

Figure 1: The following figure displays a wind turbine that can be used to create energy from wind. This is another positive alternative to fossil fuels as it is renewable and safe. This shows how the turbines are rotated from strong winds and in turn transfer that energy into underground electrical connections that is usable energy.
Link to IMAGE
Video about solar energy
Below is a video about solar energy and the basics behind why and how to use it. It talks about how the sun is the most powerful and renewable energy source that we have and how we should utilize it. It talks about how we have desert areas that are so vast that we could if we truly wanted place enough solar panels to capture the energy that could supply the entire Earth with energy. It talks about the two different ways to create solar energy, one way being a more direct way where the panels translate sunlight directly into electricity and the other is the traditional heating water to create steam and power plants to make energy.
Link to VIDEO
Solar energy Pros versus Cons
Solar energy is often a thought of alternative to burning oils and gases, but how much do you actually know about the making and use of solar energy. In this website there is list of pros and cons of using solar energy, some pros being that it is safer and con being that it is quite expensive to build them. Check out if you think the Pros outweigh the cons below.
Link to website HERE
Link to website HERE
Mitigation: Solar energy
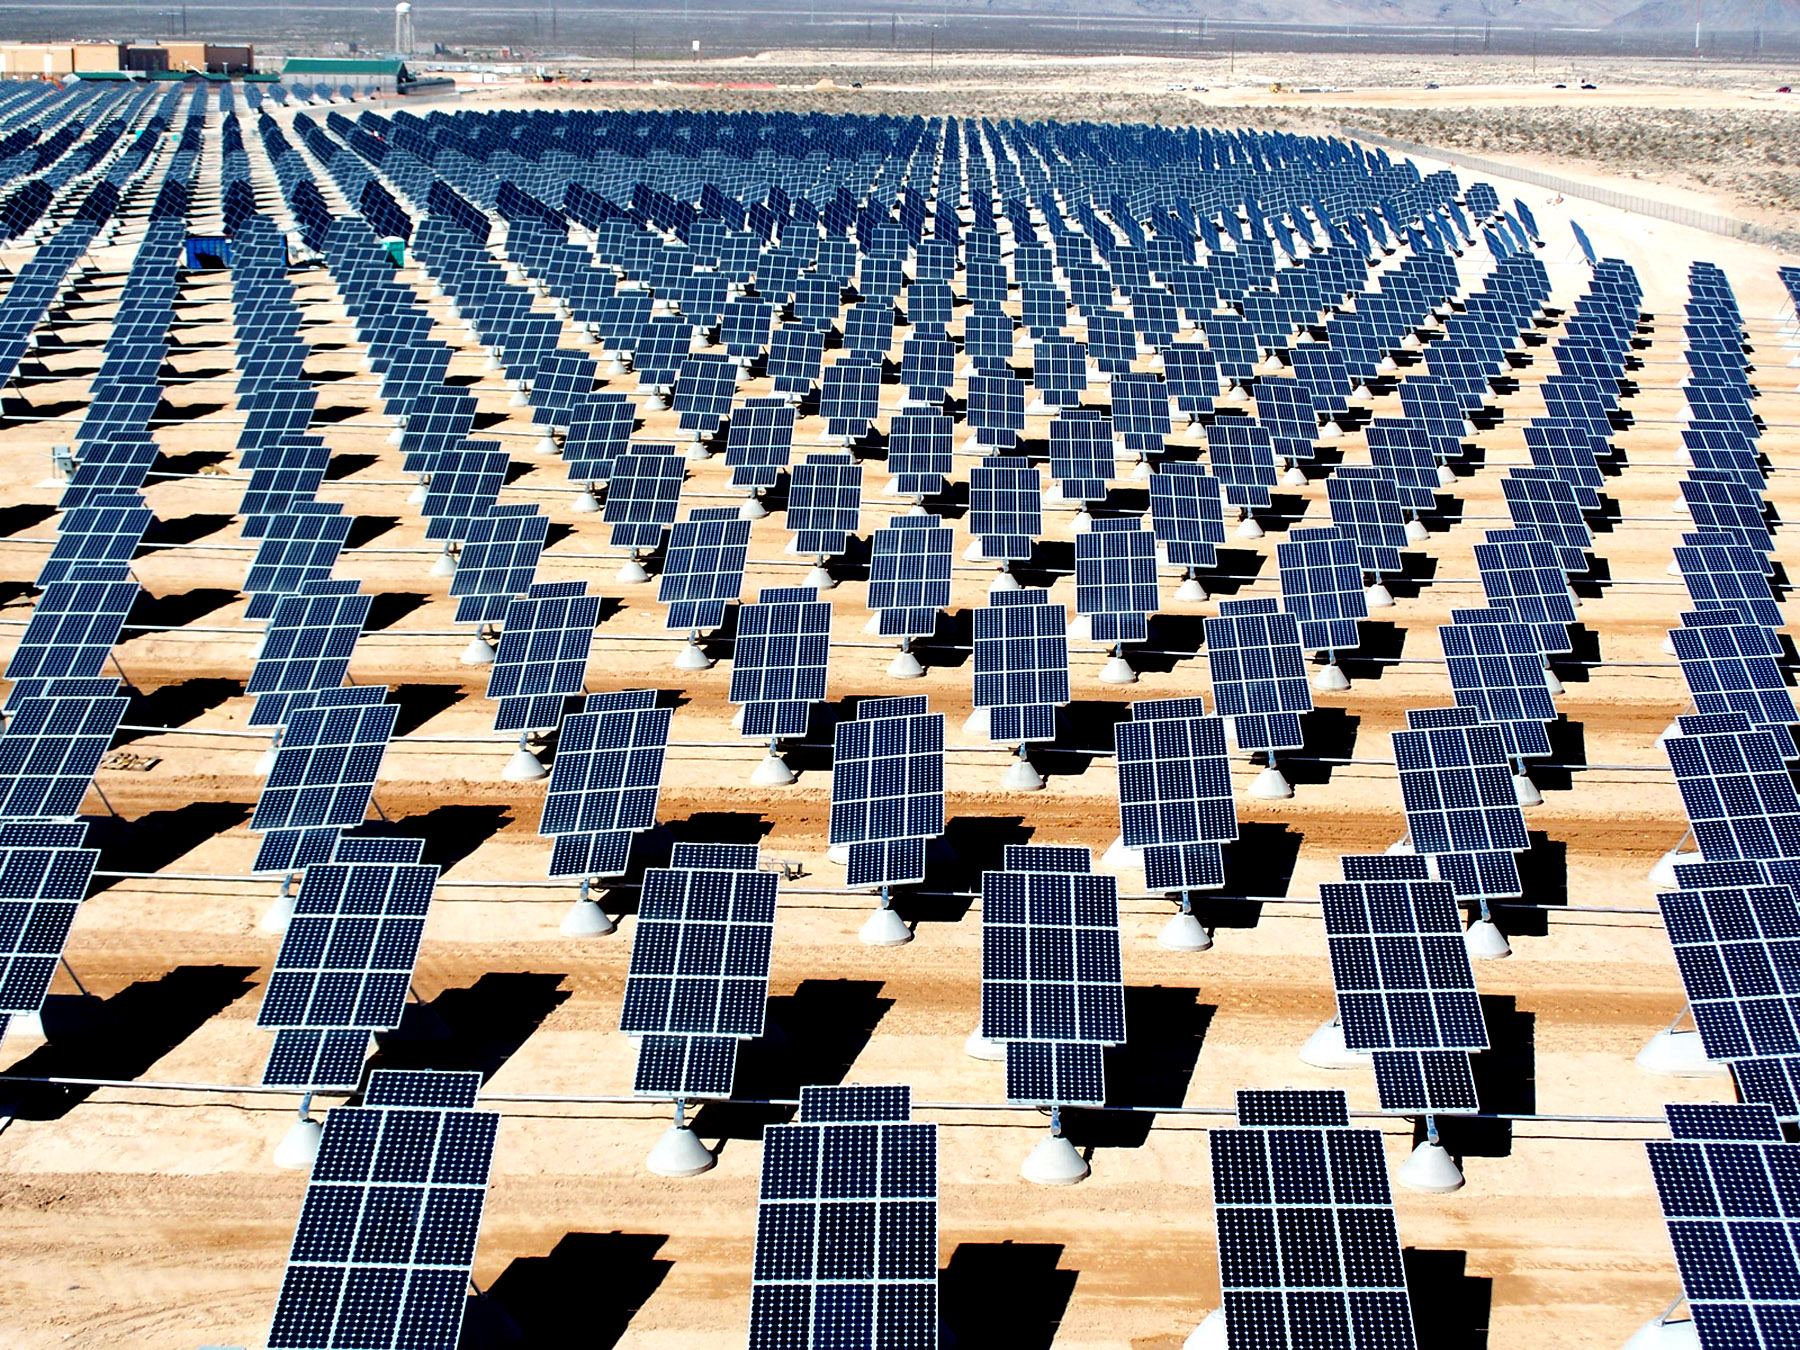
Figure 1: This image shows a large scale use of solar panels to create the use of solar energy. This is one way to go about mitigation as people propose to switch from fossil fuels towards cleaner and safer energy sources such as solar.
Link to IMAGE
Video about impacts of climate change
The video below talks about the impacts of climate change. More specifically it takes about the connection between climate change and the economy and how our economy is reliant on our environment. It is a very good and entertaining video that talks about the short versus long term effect of acting on helping improve the environment. It is very simple and has good connections and worth watching.
Link to the VIDEO
NASA on the impacts of climate change
NASA has a great website about the impacts of climate change. It talks a bit about the IPCC and their findings and study, but then goes on to list each continent and tell of the predictions for the future. Like in North America it is predicted that there will be an increase of rain fed agriculture, a decrease in snowpacks in western mountains, and longer hotter heat waves in areas that experience them.
Check out the other areas HERE
Check out the other areas HERE
NY Times article about present Climate change impacts
New York Times posted an article today May 6th about how climate change impacts are already showing. It talks about how there is more rain overall in the east, how hotter areas are getting hotter and seeing more droughts or wildfires, and how the mainly the Earth is getting warmer. It also has a nice picture showing the temperature changes overtime. This is worth a look as it is so relevant and recent.
The article is HERE
The article is HERE
EPA on Impacts affecting Human Health
The EPA is such a useful website and has a page dedicated to how climate change impacts can affect human health. This site lists off different possible factors resulting from climate change such as heat waves, extreme weather events, and air quality. These are all possible and the EPA goes through to talk about how things such as an increase in extreme weather events can affect the availability of fresh food and water as well as many other things.
To see all the possibilities go the EPA website HERE
To see all the possibilities go the EPA website HERE
Climate Change impact Depiction

Figure 1: This image is a very technical approach to showing the impacts of climate change. Its actually very good, because it not only lists off some possible impacts, but also shows how those impacts will specifically affect different areas such as humans and agriculture.
Link to IMAGE
Image of Impacts of Climate change
Figure 1: This is a visual approach to show the impacts of climate change. I personally enjoy these kinds of images more because of being just a visual learner. This is helpful in understanding and focusing a lot on hoe climate change impacts in water and oceanic aspects.
Link to IMAGE
Impacts of climate change

Figure 1: This image is a jumble of the impacts of climate change. This is interesting and lists a lot of aspects, but can be a bit hard to read. Still useful in understanding that the impacts are multilateral and not just only global warming or whatever.
Link to IMAGE
Video about making a Climate model
The video linked below is a news report about climate models. This talks about the process behind making a climate model. It shows some visuals about what they can predict and other aspects of climate models and that they are actually pretty reliable. Short and fast video but useful.
Link to VIDEO
Climate change Modeling Video
The following (below) is a video about the use of climate models to predict the future. It is a fairly lengthy video ~9 minutes that talks about generally what models exactly are used for, how they work, and how to make them. It talks about making the Earth into a grid to project areas and using formulas that help to understand the past and future of climate change and the Earth overall. This is a very good movie and is a general outline of the whole idea and use of models and is worth watching.
Link to VIDEO
Climate Change Model (graph)
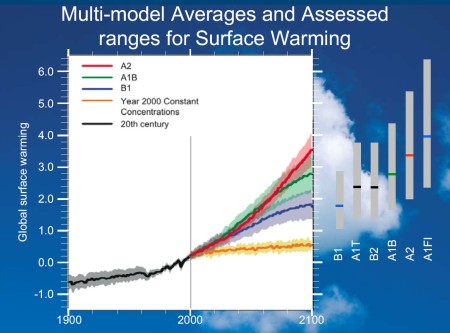
Figure 1: This is another type of climate model which uses hypothetical predictions of future behavior to map out ranges for surface warming over time. This shows 4 different models on the graph with lightly shaded areas to show the range of error involved with giving the predictions on surface warming for the next 100 years. This model goes well with the understanding of what these scenarios are, which can be found online.
Link to IMAGE
Climate Change Model

Figure 1: This image by the EPA is the estimated temperature rise up the the year 2100. There are two scenarios that are predictions based on our level of emissions within this time, either the lower possible which predicts at most 6 degree change and the higher which predicts up to 9 degree change. This is one style of a model which visually shows the change over time with a scale for the colors.
Link to IMAGE
Modeling EPA
The EPA website has a wide range of information of climate change, one of which is a page on Climate modeling. This has many different kinds of models some of which are directed at mitigation, such as their non-CO2 projections model which is based on sectors that are emitting greenhouse gases that are not carbon dioxide, which is useful in predicting how much different emissions affect change.
Check out the website HERE
Check out the website HERE
Future Climate
Most people wonder how we can predict climate change, to do so there are many ways, but it is important what these say. The EPA on their website has good notes about predictions of future temperature and precipitation/storm events and how they are projected to rise as our emissions stay the same. It also talks about future ice change, ocean acidification, and sea level changes, stating that ice is melting and there is projected to be a level in sea rise.
If you want to read the whole page click HERE
If you want to read the whole page click HERE
Ice Albedo Video
Here is nice short video about the Ice albedo feedback and is done by NASA. This shows how the loss of ice leads to more melting because water absorbs sunlight whereas the ice and snow reflects sunlight. Very short minute or so video and basically shows how snow has melted over time since it looks to be the ice age period or following that.
Link to video HERE
Feedback Video
The video below talks about feedback's in a short video which mentions the Ice Albedo effect. It talks about the process of feedback's and then goes on to discuss a bit about how this is being impacted by us and how we need to act to make sure this does not become a serious problem.
Here is a link to the VIDEO
Ice Albedo
The Ice Albedo feedback is a useful effect to know when talking about positive feedback's, because it is partly our fault. The ice albedo basically is how snow and ice reflect more sunlight, so as the snow and ice melt it leads to warmer temperatures and more melting which becomes a cycle. This is a well known area because we as humans are known to contribute to the greenhouse effect which may be a cause of the ozone hole over the Arctic causing some of this melting.
If you want to read all about the Ice Albedo effect visit this website HERE
If you want to read all about the Ice Albedo effect visit this website HERE
Feedbacks Image

Figure 1: This shows many different feedback possibilities and how they can affect the atmosphere. Such examples of this are the interactions between Ice and the atmosphere, also called the ice albedo effect where less snow or ice means warmer temperatures and leads to more melting. This is useful in showing many different feedback's and how the can interact.
Link to IMAGE
Feedbacks Examples

Figure 1: The following depicts two different feedback's, one being positive and the other being negative. The positive feedback is about the greenhouse effect and how it leads to increased temperature and more evaporation, then more water vapor is in the atmosphere which contributes to the greenhouse effect. The negative feedback is when there is an increase in temperature there is more evaporation and more low clouds reflecting more sunlight, thus decreasing the temperature.
Link to IMAGE
Climate Change Feedbacks
The following website linked below is useful for understanding the basics of feedback's involved in climate change. It talks about the two kinds of feedback's, positive which accelerates the effects of climate change and then negative feedback's which decelerates the effects of climate change. It mentions a big factor in positive feedback's which is melting ice and how the decrease creates less reflection as the snow and ice because of their color tend to reflect more light and lead to more heat and cause more melting.
To learn more about this topic visit the website HERE
To learn more about this topic visit the website HERE
Borneo Stalagmite Video
Watch this interesting video below about using stalagmites as a proxy record to find out about past climate and help with predicting the future. This is a short video but mentions how they use fallen stalagmites that have grown from the ground up and show changes in the past about rainfall and precipitation. This is very interesting and adds to where we can collect past climate data from, this is something I did not realize and found it to be something very interesting and make me want to research further. It also mentions a little about how they exactly extract the records, but not into too much detail.
Link to video HERE
Link to video HERE
Video: Tree ring Proxy records
A video I watched that was very helpful in understanding tree ring data and what it can tell us will be below. The video talks about the connection between how climate change can negatively or positively influence the social standing of certain places. The video focuses mainly on Europe and how during times of drought they saw the loss of crops and thus lead to a decline in population from famine or just failure to find profitability. This video is very good at explaining how using records like this can help explain past events which can hopefully help us tell the future to an extent.
Link to the video HERE
Video: Ice cores
The following video talks about the use of Proxy records, specifically ice cores. It talks about how this data can be used to find out what Carbon Dioxide levels were like up to hundreds of thousands of years ago. It shows how people actually work with ice cores, being able to tell seasons and specific years and the stories they tell, such as volcanic explosions and changes in levels of Carbon Dioxide. This is something that we watched as part of an assignment, but was very interesting to me as I have always been interested in ice cores, if you would like to watch click below.
Here is the link to watch the VIDEO
Proxy records: Ice Cores
Ice cores are one of the most effective methods of collecting proxy records for data about past climate records. This is due to the ability of them to capture gases during the time they freeze and then can later be extracted to measure concentrations of things such as Carbon dioxide and methane. The website below explains much of this and more, as well as listing some flaws with timing of ice core data. It also gives the different regions where ice cores are collected and explains how deep and good the regions are for ice core data, going from Antarctica to the Arctic.
Link to website HERE
Link to website HERE
Tree Rings as Proxy record

Figure 1: Many people know that you can tell the age of a tree through counting the rings, but some do not realize that those rings can also be used to tell the climate of the time. For example, thicker rings represent higher precipitation years as that tree grew more during that time. The downside to tree rings is that they are not as long living as some others such as ice cores and ocean sediments.
Link to IMAGE
Time use of different Proxy records

Figure 1: This depicts the span of how long each proxy record can pretty accurately predict the climate, so for example ocean sediments can tell millions of years into the past with good accuracy. It is also important to note that the thicker the most data is collected from. It is a good chart to get an idea of which records are good for which length of time since we have only had instrumental records for so long, and have collected data for shorter.
Link to IMAGE
Proxy records: What are they?
If you ever wondered why we are able to make predictions about what past temperatures and climates were like before we were alive then you should check out the link below about proxy records. It outlines 4 major proxy records that we use in tree rings, ice cores, ocean and lake sediments, and corals. Each of these have their own unique use in telling the story of past climates and this website gives a good description of why we use each. It also gives an explanation of what a proxy record is at the start, and is a good initial point to start if you want to learn more.
My personal favorite are ice cores, check it out HERE
My personal favorite are ice cores, check it out HERE
New York Times Nuclear Power Plant Article[4-27-14]
There was a recent newspaper article from the New York Times written around april 27 that talks about how phasing out nuclear power plants was not really a good idea. It gives the idea that it may die out before zero-carbon energy is completely introduced and that it is taken for granted when in reality it is falling out and may be irrelevant in the future. This is an interesting read for anyone interested in the use of nuclear power plants and how they are doing at the moment.
Read the article HERE
Read the article HERE
Greenhouse effect Video
Here is another video about the Greenhouse effect. It makes a good comparison to the greenhouses that we humans use to grow plants and compares it to the effect it can have on the Earth globally. It also gives some results due to the rising heat and the Greenhouse effect, very short but informative video for someone who wants a brief intro into the causes and how it works. Watch the video below.
Link to video HERE
How the Greenhouse Effect works
There is a short little goofy video that shows an animated way in which the greenhouse effect works. It gives a little insight into what will happen, but is a bit extreme. You can watch the video yourself below.
Link to video on YouTube HERE
Human activities that contributed to the Greenhouse effect
Linked below is a good resource to understanding what humans do that adds to the greenhouse effect. It lists the more well known ideas, being that humans burn fossil fuels that add carbon dioxide to the atmosphere and also transportation because it also burns gases contribute. This also lists facts that people may not know, things simple as deforestation adds to the effect, because plants and trees absorb carbon dioxide and some gases through photosynthesis. Also the fact that the way we use land adds to the effect, most obviously if we are building industry buildings it will directly add to the effect.
If you would like to view the list click HERE
If you would like to view the list click HERE
Greenhouse effect and Gases added over time

Figure 1: In this graph it can be seen that in the recent years and around the time of the industrial revolution the amount of greenhouse gases in the atmosphere sharply rose. This can be attributed mainly to humans and the industrial revolution where we started to use more coal and fossil fuels as energy and burned them which adds to the pollution in the atmosphere.
Check out the image HERE
Greenhouse effect Picture
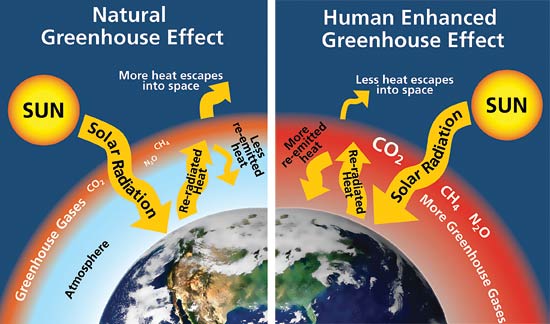
Figure 1: This image depicts the idea and way that the greenhouse effect works, where we add more heat to the atmosphere, as well as it causing less heat to escape into space. This generally exemplifies all parts of the Greenhouse effect and how humans contribute to this and cause a rise in heat more than one way other than simply adding these gases.
Link to IMAGE
Greenhouse Gases
When understanding the topic of Greenhouse gases it is important to understand the reasons it is happening and what does this mean to us as humans on the planet.The EPA website has a nice page giving a general and short outline of greenhouse gases. It charts the major greenhouse gases that affect the atmosphere and how they are produced. It also includes how long they stay in the atmosphere so it adds some idea of how quickly we have to react to change.
If you want to read the whole page click the link HERE
If you want to read the whole page click the link HERE
Comparisons of Different Energy sources
If you are thinking about what other options that we have compared to oil, coal, and other fossil fuels then I suggest looking at a comparison chart like the one linked below. In my opinion, I think Nuclear energy is actually a fairly good alternative looking at the benefits as being inexpensive fuel, does not cause or add to the greenhouse effect, and has the most compact waste of all sources. In your mind does this outweigh the cons, and also check out the other energy sources of coal, gas/oil, solar, wind, etc.
To make your own opinion check out the LINK to the webpage
To make your own opinion check out the LINK to the webpage
Graph about Cost of Energy Plants

Figure 1: This graph shows the operating cost of multiple energy plant sources ranging from solar to coal to nuclear to hydro-electric. This is useful in understanding that Nuclear energy is actually very cheap to make compared to what we use today, coal and fossil fuels. It also is a good comparative to other thought about options such as solar and wind energy.
Link to Photo
Process of Nuclear Energy
Nuclear Energy is just like any other energy plant in which it has to create heat to turn water into steam and get the plant to start a generator and in turn get the electricity we need. It actually has a neat little video player if you click on the image which gives a visual of the process. If you want to know more about the process or more in depth check out the website linked below.
Link to Webpage
Link to Webpage
Myths about Nuclear Energy
I read an interesting piece about the myths behind nuclear energy. It ranges from the beliefs about the accident in Chernobyl and that it can occur to us to the idea that Nuclear energy is bad for the environment. I think a lot of these myths are very surprising and should definitely be checked out by clicking on the link below.
Link to Myths
Link to Myths
Interesting Facts about Chernobyl
If you want to learn some facts about Chernobyl and the Nuclear accident you should watch this Video. It is a short video listing ten interesting facts about Chernobyl and the Nuclear accident. Some are pretty known ones such that the citizens of the area did not know about the first explosion until two days after. Then there are some that are very interesting and I am even unsure if they are true, find out and watch the video linked above.
Chernobyl Video
This video is a very quick and enjoyable video to watch if you are interested in the results of Chernobyl. It gives a brief description at the beginning of what happened, where it happened and then continues to show a slide show of photos from before and after of the Chernobyl accident.
Link to video HERE
Link to video HERE
Cherbonyl Nuclear Plant Accident in 1986
If you are like me then you would have been interested in Nuclear energy when talking about climate change, because personally I always thought it was the most dangerous and threatening way to create energy. After reading the facts about probably the most famous accident in Chernobyl, I realized that much of the reasons behind the accident had little to do with the fact of dealing with nuclear energy, and was rather due to design and human error. This page by the World Nuclear Association outlines in great detail all the reasons for the accident and the effects that occurred. The most important piece of information I learned is from the section about what has been learned from the Chernobyl accident.
Read for yourself HERE
Read for yourself HERE
Environmental Protectoin Agency Webpage
This website is a very good start if you want to educate yourself on the topic of climate change. It has many different areas to view from basic information about climate change to the science behind climate change and how it is happening. It also separates the United States into regions so you can be informed about your own specific area. Then, it has an area dedicated to the ways to help stop or mitigate climate change, specifically how to reduce the greenhouse effect and emissions, what they are doing specifically, and then what you can do individually to help contribute. It is a good general source to educate yourself.
If you want to learn more you can go to their WEBSITE
If you want to learn more you can go to their WEBSITE
Photo of Polar Bear in Melting Ice Area
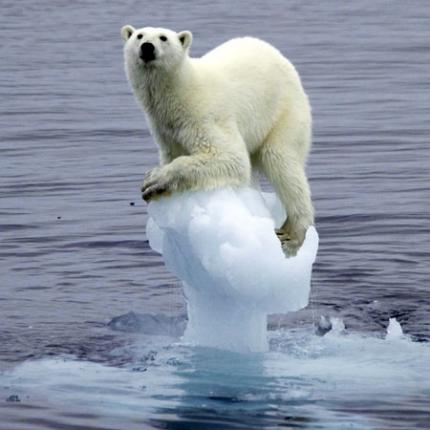
Figure 1: This is to me the universal depiction of Global warming, which is a result of Climate Change, the Greenhouse Effect, and the depletion of the Ozone [Ozone Hole]. If this doesn't make a person think that global warming or climate change is happening then they should do some research and this picture personally sparks interest in the topic of climate change.
Link to photo HERE
Cartoon drawing of Climate Change

Figure 1: This is one of the first photos I looked at when I started learning about Climate Change. It shows two different major ways that the environment can be affected from climate change, being extreme heat or more precipitation. It is interesting due to the fact that many think that Climate change is just Global warming from the Greenhouse effect, but it is actually more than that and this picture points that out nicely.
Link to photo HERE
Political Cartoon about who climate change is caused by and who it affects

Figure 1: This picture is a good description of why climate change matters. It depicts the larger industrialized nations who actually pollute causing climate change which is going to wipe out the more developing countries. This basically is true to some parts because as larger and wealthier countries we can afford to adapt whereas smaller developing countries are unable to with climate change. Its also important to note that certain areas are more susceptible to dangerous climate change and most are not in the countries that are causing, so it may not directly hurt us, but its a global issue not a personal issue.
Link to Image Here
Monday, May 5, 2014
Subscribe to:
Comments (Atom)